Introduction: Long-Term Population Dynamics of Kenai River Late-Run Sockeye (1979–2024)
Download the Full PDF Analysis
The Kenai River supports one of the most culturally and economically significant sockeye salmon (Oncorhynchus nerka) fisheries in the world. As a keystone species, the late-run sockeye population is a critical indicator of the health of the Cook Inlet watershed and the North Pacific marine environment. For fisheries managers, maintaining “escapement”—the number of salmon that successfully bypass harvest to reach their upstream spawning grounds—is the primary objective for ensuring the long-term sustainability of the stock.
Scope and Objective: A Focus on Quantitative Facts
It is important to note that this analysis is strictly analytical in scope. The analysis is intentionally designed to report facts gleaned directly from the data and to evaluate the mathematical certainty of the conclusions reached. It does not attempt to explore the underlying biological, environmental, or anthropogenic “why” behind the population shifts. By focusing on the quantitative foundation of the run, this research provides the evidence-based clarity necessary for informed resource management.
The findings detailed in the full analysis focus on four major areas of the Kenai River late-run sockeye population:
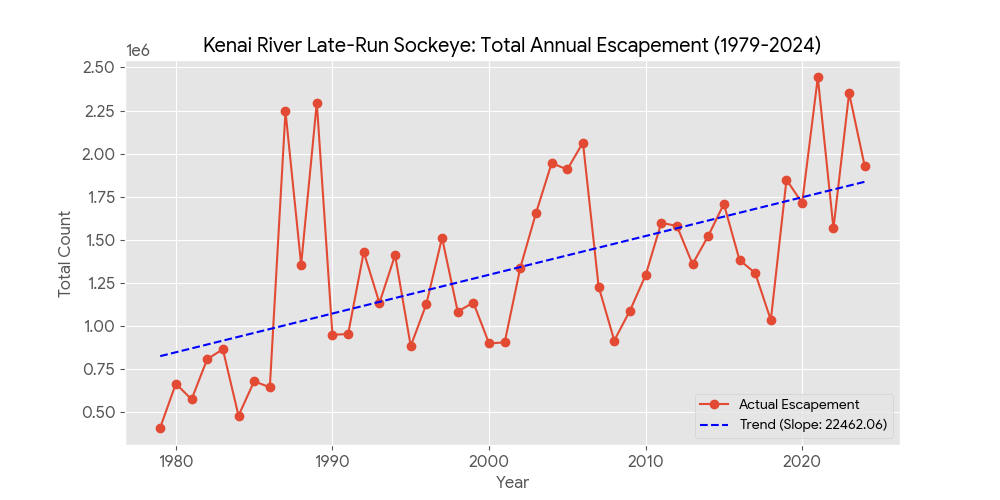
- Sustained Biomass Growth: The population has followed a significant upward growth trend for over four decades, adding an average of approximately 26,263 fish per year.
- Phenological Shift: The peak of the run is arriving significantly later than in previous decades, showing a total delay of nearly 8 days since the late 1970s.
- Arrival Distribution: The run has transitioned from a “bursty,” compressed window (Leptokurtic) to a more consistent and “flattened” arrival window (Mesokurtic/Platykurtic).
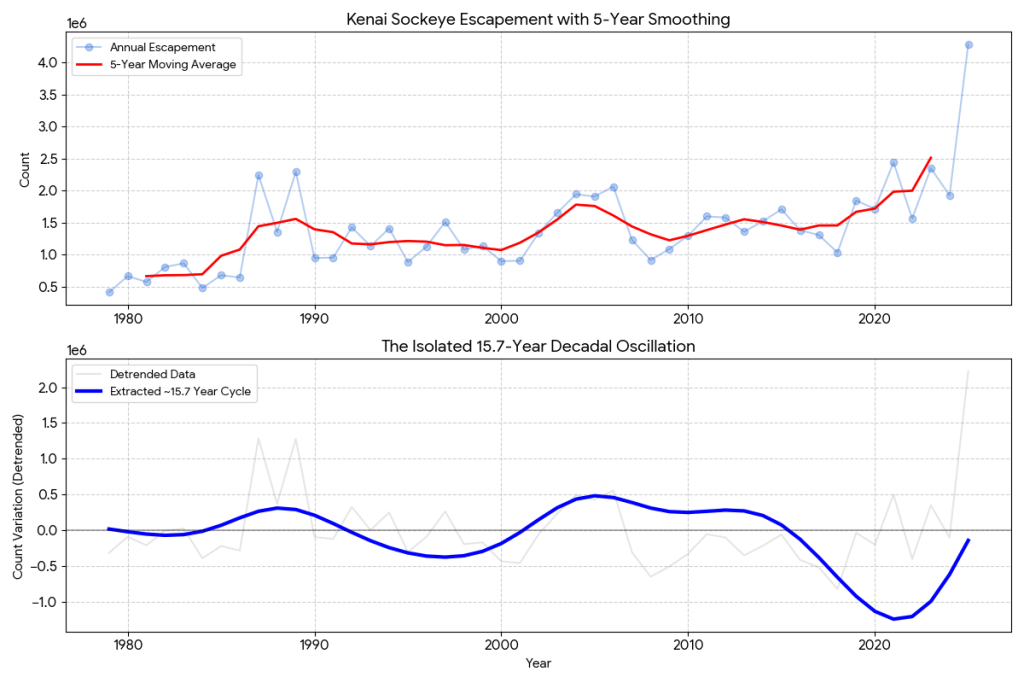
- Environmental Oscillations: Beyond standard 4-year biological cycles, the data reveals a prominent 15.7-year sinusoidal oscillation, suggesting the influence of powerful decadal environmental factors.
46-Year Analysis Reveals Kenai Sockeye are Booming, but Arriving Later
By Jim Voss
For nearly half a century, the Kenai River has served as the biological heart of Alaska’s Cook Inlet, supporting a sockeye salmon fishery that is as much a cultural touchstone as it is an economic powerhouse. But a comprehensive new analysis of 46 years of escapement data reveals that while the river’s famous late-run sockeye population is growing at a massive rate, the fish are fundamentally changing their behavior, arriving later in the summer and abandoning the “bursty” migration patterns of the past.
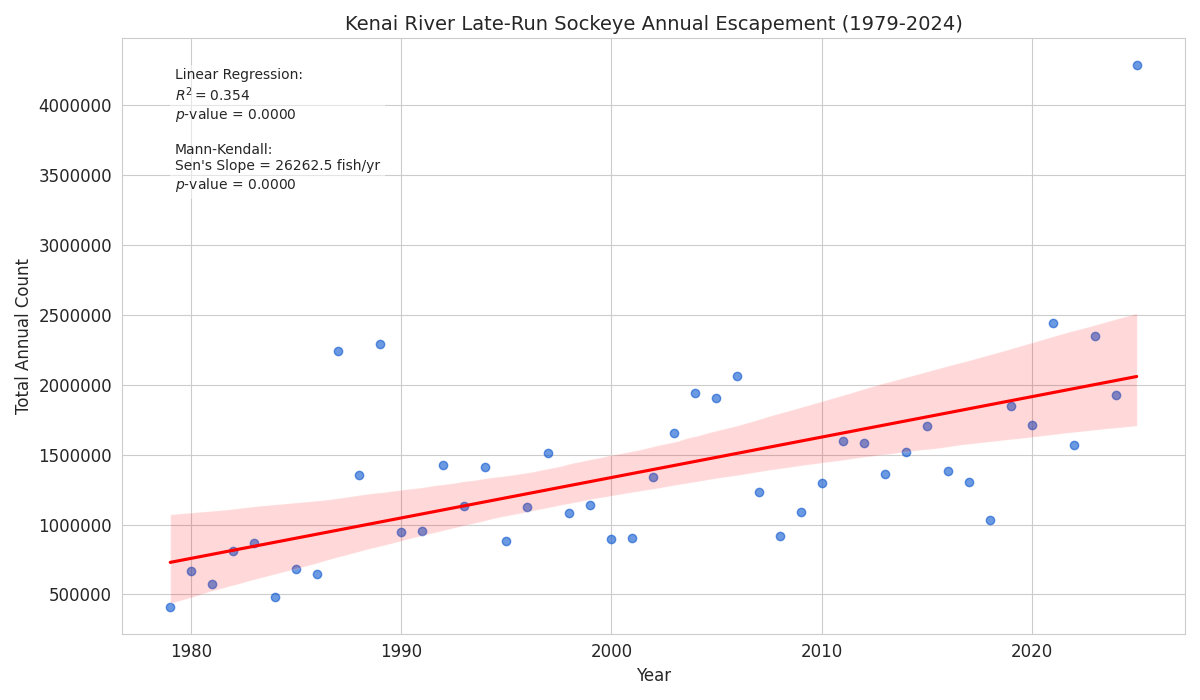
This analysis, a time-series analysis spanning from 1979 to 2024, filters out the “noise” of year-to-year environmental fluctuations to reveal a population in a state of significant long-term growth. Using a dual-method statistical approach—Ordinary Least Squares (OLS) regression and the non-parametric Mann-Kendall trend test—researchers have confirmed that the Kenai’s productivity is not just stable, but surging.
A Surge in Biomass
The raw numbers are staggering. According to the study’s Sen’s Slope estimate—a measure resilient to extreme “boom” and “bust” years—the annual “escapement” (the number of salmon that successfully bypass harvest to reach spawning grounds) has increased by an average of approximately 26,263 fish every single year since the late 1970s.
“Analyzing nearly half a century of biological data allowed us to filter out the inherent ‘noise’ of inter-annual environmental variability and identify the underlying trajectory of the population,” the analysis states. This growth isn’t just a statistical fluke; the findings cleared rigorous mathematical tests by a “massive margin,” with a p-value of 0.00001—a result 100 times more certain than even very strict scientific thresholds.
However, this growth comes with a caveat. While the population is larger, it is also increasingly volatile. The analysis found that roughly 64.6% of the variance in annual counts is driven by external factors like fluctuating marine survival and environmental conditions. Even so, the overall trend remains clear: the Kenai River late-run sockeye population is growing.
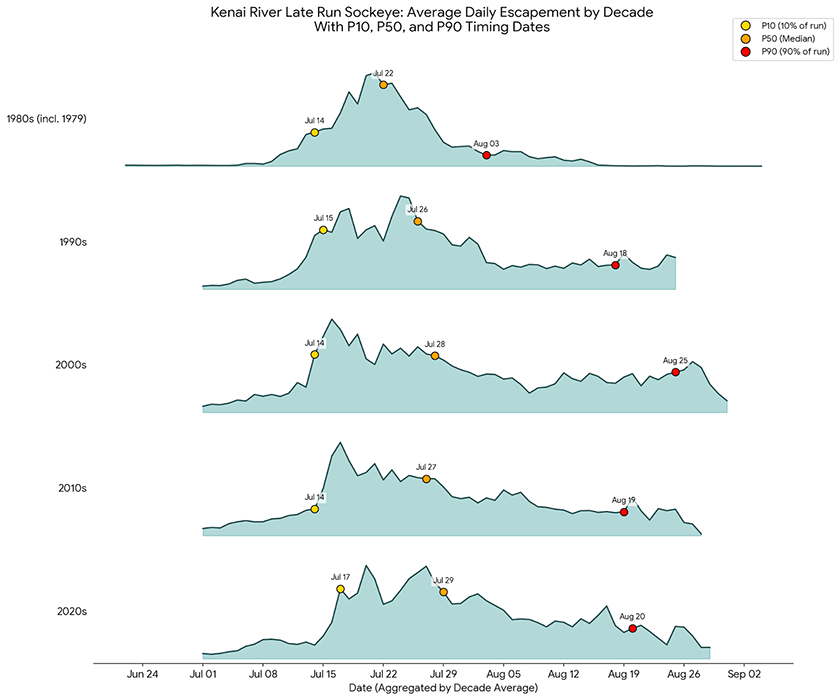
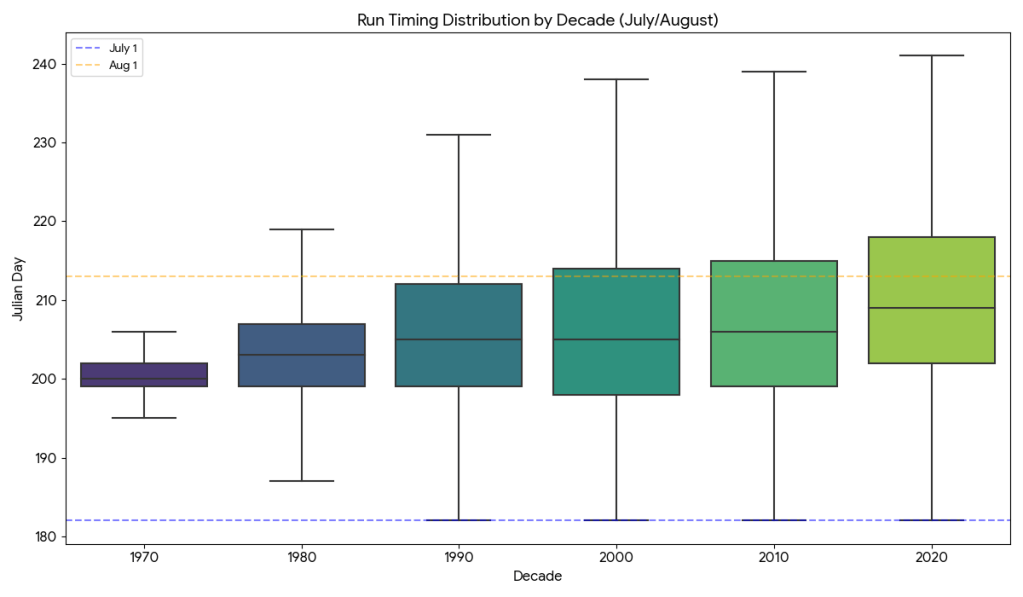
The Eight-Day Shift
Perhaps the most significant finding for local anglers and commercial harvesters is the dramatic shift in migration timing. The peak of the sockeye run is now arriving nearly eight days later than it did in the late 1970s.
This “phenological delay” is occurring at a rate of 1.73 days per decade. In the late 1970s and 1980s, the mean arrival date was July 22; by the 2020s, that date had slid to July 30.
“The trend of delayed arrival is statistically significant,” the analysis notes, suggesting that the probability of this shift occurring by random chance is effectively zero. This delay means the traditional “peak” of the season has moved, forcing a potential rethink of management strategies that have been in place for decades.
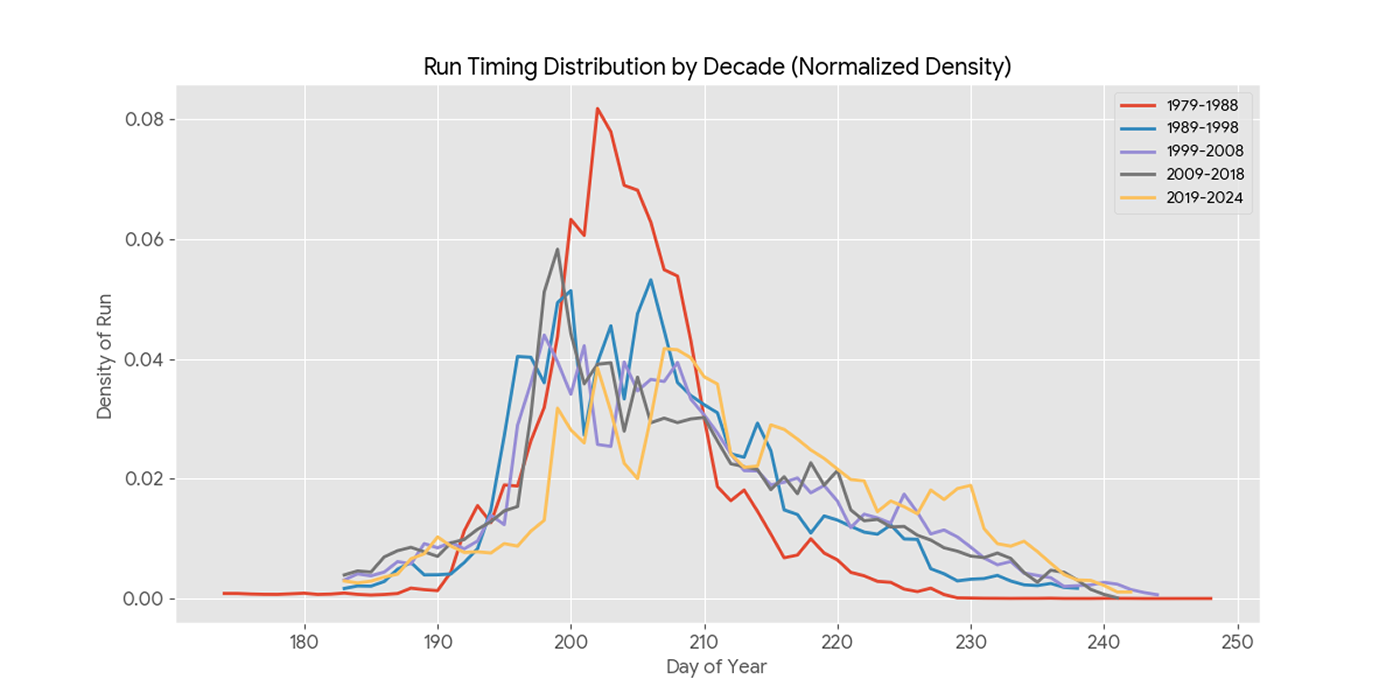
From ‘Bursty’ to ‘Consistent’
It isn’t just when the fish arrive that has changed, but how they arrive. The analysis shows a “shape analysis” of the run’s distribution, comparing the first decade of data to the last.
In the 1980s, the Kenai sockeye run was characterized as “bursty”. Historically, the bulk of the salmon arrived in a very short, compressed window, creating massive single-day peaks. To a statistician, this is known as a “leptokurtic” distribution—a sharp, narrow spike in numbers.
Today, the run has “flattened”. The modern migration is “mesokurtic” or “platykurtic,” meaning the fish are arriving over a much broader window of time. The variance in arrival times has more than doubled since the 1980s, moving from a concentrated burst to a more consistent stream of fish throughout the summer.
The 15.7-Year Mystery
While the analysis intentionally avoids speculating on the “why” behind these changes, focusing instead on reporting only on the data, it did uncover an interesting long period cycle.
Sockeye are typically known as four-year fish, however, this analysis found almost no correlation between escapement numbers and the three, four, or five-year biological marks.
Instead, after “detrending” the data to remove the influence of steady growth, the analysis shows a “very obvious” sinusoidal function—a rhythmic wave in the population—with a period of about 15.7 years. This decadal oscillation suggests that massive environmental cycles, such as the Pacific Decadal Oscillation, may be far more powerful than the salmon’s own reproductive cycles. This could be an area for further data research to see if this same exact sinusoidal oscillation can be found in many of the rivers throughout Alaska and specifically even look at the Cook Inlet watershed since that’s where the Kenai River empties.
Could Early Run Analysis Be Any Predictor Of The Total Run In Any Meaningful Way?
The analysis also attempted to see if the first 10-20 days of the run could offer any correlation at all to other parts of the run in general – such as P50, P90, minimum escapement goals etc. An analysis of “P10” data—the number of fish that arrive in the first 10% of the run’s duration—showed it to be an “unreliable predictor” for final year-end outcomes.
“The correlation between the first 10% of the run and the final total was weak,” the analysis found, explaining that data gathered in early July accounts for less than 20% of the final variation. This high early-season variance means it is almost impossible to predict whether a run will meet, exceed, or fall below the Sustainable Escapement Goal (SEG) based on early July numbers alone.
Conclusion
The data paints a picture of a river system in transition. The Kenai sockeye population is larger than it has been in decades, but it is also later and more spread out with the peak of the run arriving consistently 8-days later than it did at the beginning of the study and moving consistently 1.7 days per decade later.
For now, the facts are clear: the fish are coming in record numbers—you just might have to wait an extra week to see them. The question to continue to watch is, will this trend continue?


To ensure the research remains transparent and accessible, the following definitions explain the technical terms used to evaluate the Kenai River sockeye population:
- p-value: The probability that the observed trend happened by random chance. In this study, the p-value for growth was 0.00001, meaning there is an extremely low probability the growth trend is a product of random luck.
- Sen’s Slope: A statistical method used to find the average rate of change over time that is resilient to extreme “boom” or “bust” years. The study identifies a Sen’s Slope of 26,262 fish per year.
- R-squared (R^2): A measure of how much of the variance in annual counts is explained by the passage of time. The value of 0.354 suggests that while the time-trend is highly significant, 64.6% of the variance is driven by other inter-annual environmental factors.
- Leptokurtic: Describes a “bursty” run where the vast majority of fish arrive in a very short, intense window, creating massive single-day peaks.
- Platykurtic: Describes a “flattened” run where fish arrive over a much broader window of time, indicating a more consistent migration pattern.
- P50 (Median Passage): The “halfway point” of the run—the specific day by which half of the total run has passed the sonar.
- Autoregressive Process (AR(2)): A statistical finding that the current year’s count is most strongly influenced by the counts of the previous two years, rather than a 4-year biological cycle
Click The Links To Download The Mobile App Today

